Hello everyone,
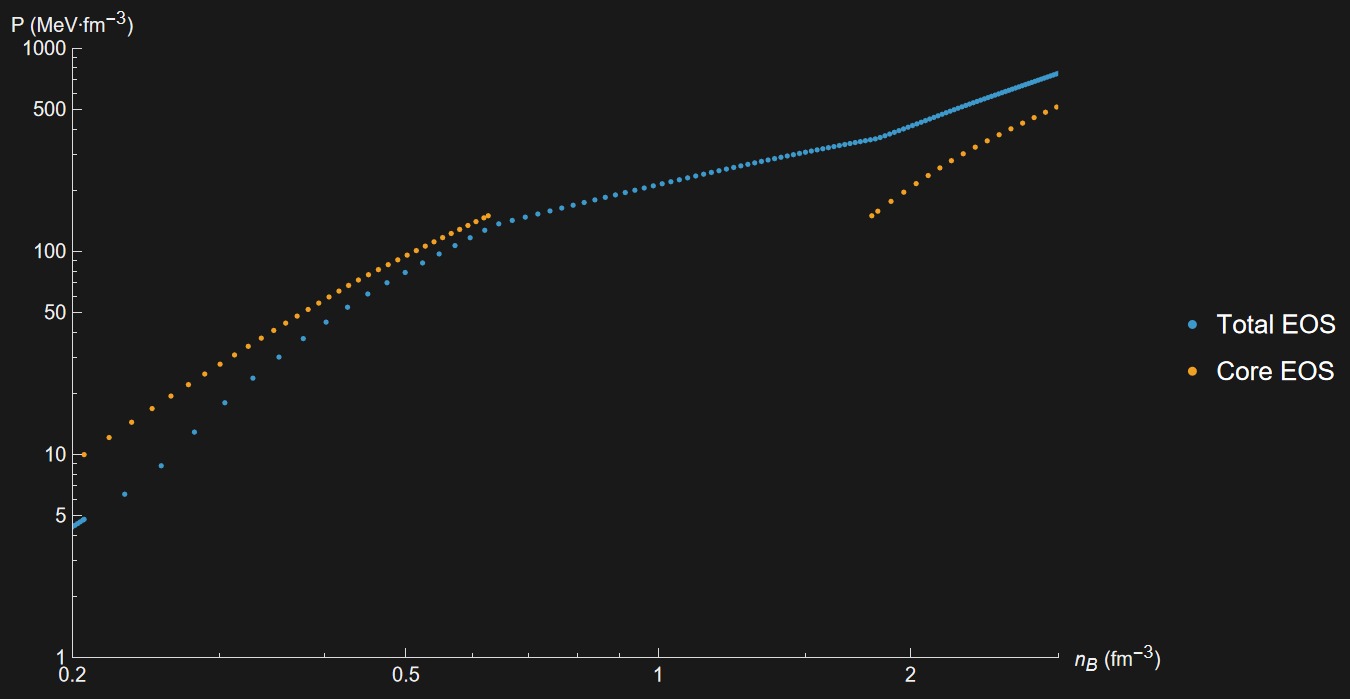
We are finding some strange behaviour for the equation of state when including quarks. Other than our previous question regarding the Gibbs construction, using simply the Maxwell construction in the core yields the yellow points on this pressure vs baryon density plot.
Those look quite normal, with the expected discontinuity. However, when we go forward and perform the remaining two syntheses (cust+ChEFT and that with core) using the hyperbolic tangent method, we find the blue points.
Those represent the final equation of state data of pressure and, as you can see, at large pressure, they go above the data of the quark phase. We’re performing the final synthesis at nB = 0.23, with a gamma of 0.02, so it should be narrow enough such that at nB=0.5 the curve should strictly follow the core behaviour of the yellow points.
Are we missing something regarding how the synthesis module works for the quark case? How is it possible it reaches a larger value of pressure at the very centre than what is predicted by the quark EOS? It seems as if the hadronic phase had been extrapolated somehow.
We checked, by the way, that this strange behaviour is not present when quarks are not included: in the EOS we created with Octet/Decuplet, the final EOS correctly follows the Core EOS after the final synthesis.
Thanks very much in advance,
Federico and Fernando